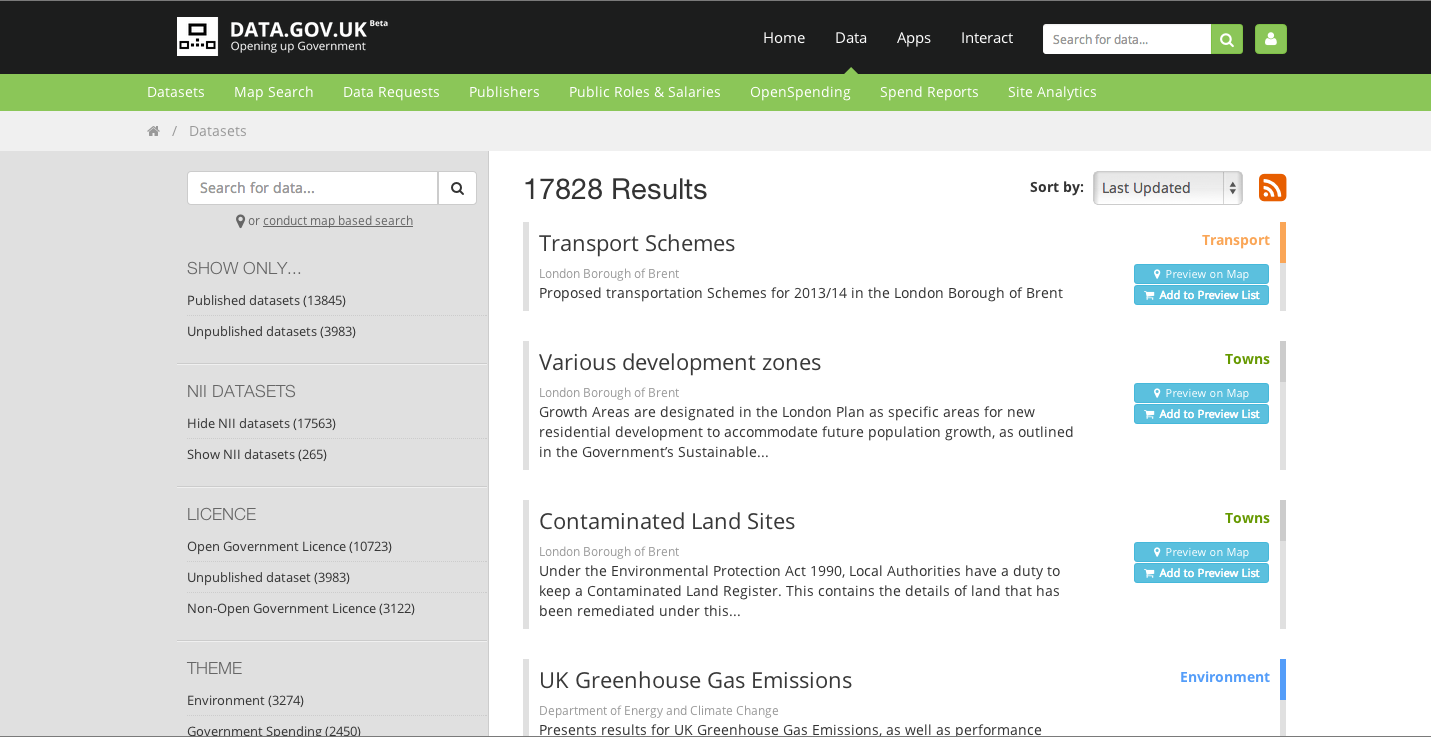
The data.gov.uk site issues public data regularly and provides it in excel .xls format. It has an easy to use interface and it is searchable by many criteria. And because it's from the UK Government, it should be fairly reliable as a data source. It looks like this:
I've decided to use data counting gypsy traveller sites issued in the last few days, as it has nice clear location data and some solid numbers about how many caravans are on each site.
The data looks like this in Excel:
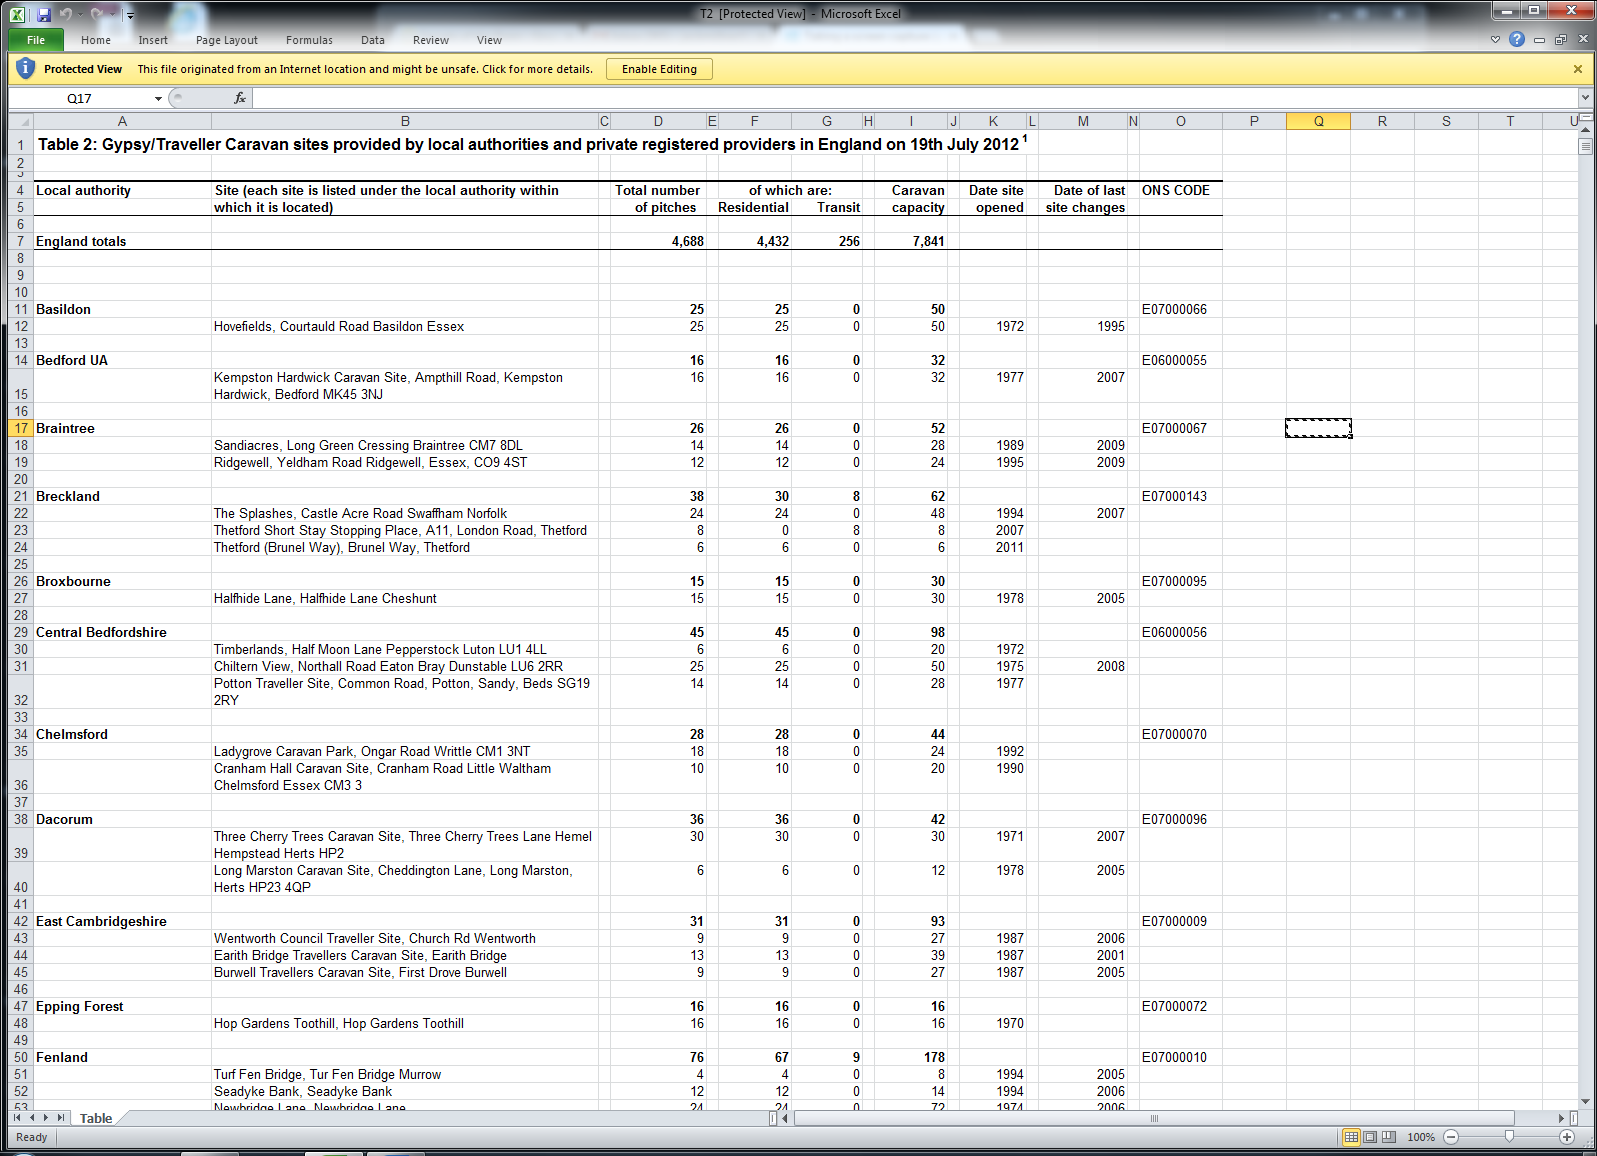
I am only really interested in the 'total number of caravans column', and the 'site' column which contains addresses. I'll keep the 'Date site opened' column too, so we have a bit more info on the map, but as a general rule, keep visualisations simple and clear.
So all the other columns and rows need to be deleted, as do the separator columns. I copied and pasted the columns I wanted into a google spreadsheet (you need a google account for this). It will looks like this:

Import the cleaned data into your fusion table. It will ask which row has the labels - in this case it is row 1. When that is done, it will look like this:

Now we need to tell the fusion table to recognise column 2 as location data. To do this, click on the arrow that appears when you hover over that column and select 'change' from the drop-down menu.
Change 'type' from 'text' to location. When this is done, the column should be highlighted yellow. Then click on the little red plus sign at the top of the page and select 'add map'.
A box should pop up and tell you that it is 'geocoding'. This means it is reading the addresses and post codes, and translating that into latitude and longitude to place it on a map.
It will look like this:

This will take a few minutes, but when it's done, click on publish and you will be given the option to copy the code. Paste it into a blogger site (it won't work on wordpress) and you have an interactive map. Click on the data points to find out how many caravans are on each site, as well as when they were founded.
If you want to change the size of your map on the page, go into the HTML and adjust the width and height.
If you want to colour-code the sites into different bands based on how many caravans they have, then click on 'change feature styles' and go into 'buckets'. Play around with the settings.
In this map, I have divided the same data into three 'buckets':
No comments:
Post a Comment